| Albania | |
| Number of imprisoned women | 75 |
| Percentage of prison population | 1.4 |
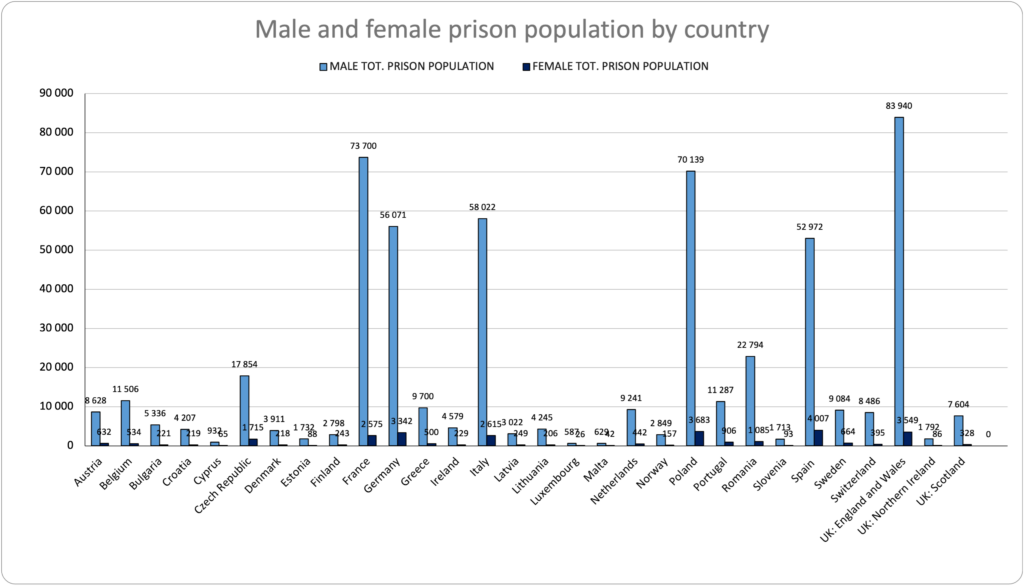
| Austria | |
| Number of imprisoned women | 632 |
| Percentage of prison population | 6.8 |
| Belgium | |
| Number of imprisoned women | 534 |
| Percentage of prison population | 4.4 |
| Bulgaria | |
| Number of imprisoned women | 221 |
| Percentage of prison population | 4 |
| Croatia | |
| Number of imprisoned women | 219 |
| Percentage of prison population | 5.35 |
| Cyprus | |
| Number of imprisoned women | 65 |
| Percentage of prison population | 6.5 |
| Czech Republic | |
| Number of imprisoned women | 1,715 |
| Percentage of prison population | 8.8 |
| Denmark | |
| Number of imprisoned women | 218 |
| Percentage of prison population | 5.3 |
| Estonia | |
| Number of imprisoned women | 88 |
| Percentage of prison population | 4.8 |
| Finland | |
| Number of imprisoned women | 243 |
| Percentage of prison population | 8 |
| France | |
| Number of imprisoned women | 2,575 |
| Percentage of prison population | 3.4 |
| Germany | |
| Number of imprisoned women | 3,342 |
| Percentage of prison population | 5.6 |
| Greece | |
| Number of imprisoned women | 500 |
| Percentage of prison population | 4.9 |
| Hungary | |
| Number of imprisoned women | 1,572 |
| Percentage of prison population | 8.4 |
| Ireland | |
| Number of imprisoned women | 229 |
| Percentage of prison population | 4.8 |
| Italy | |
| Number of imprisoned women | 2,615 |
| Percentage of prison population | 4.3 |
| Latvia | |
| Number of imprisoned women | 249 |
| Percentage of prison population | 7.6 |
| Lithuania | |
| Number of imprisoned women | 206 |
| Percentage of prison population | 4.5 |
| Luxembourg | |
| Number of imprisoned women | 26 |
| Percentage of prison population | 4.2 |
| Malta | |
| Number of imprisoned women | 42 |
| Percentage of prison population | 6.3 |
| Netherlands | |
| Number of imprisoned women | 442 |
| Percentage of prison population | 4.6 |
| Norway | |
| Number of imprisoned women | 157 |
| Percentage of prison population | 5.2 |
| Poland | |
| Number of imprisoned women | 3,683 |
| Percentage of prison population | 5 |
| Portugal | |
| Number of imprisoned women | 906 |
| Percentage of prison population | 7.4 |
| Romania | |
| Number of imprisoned women | 1,085 |
| Percentage of prison population | 4.5 |
| Slovakia | |
| Number of imprisoned women | 750 |
| Percentage of prison population | 7.7 |
| Slovenia | |
| Number of imprisoned women | 93 |
| Percentage of prison population | 5.2 |
| Spain | |
| Number of imprisoned women | 4,007 |
| Percentage of prison population | 7 |
| Sweden | |
| Number of imprisoned women | 664 |
| Percentage of prison population | 6.8 |
| Switzerland | |
| Number of imprisoned women | 395 |
| Percentage of prison population | 5.7 |
| Turkey | |
| Number of imprisoned women | 12,627 |
| Percentage of prison population | 4.2 |
| UK: England and Wales | |
| Number of imprisoned women | 3,549 |
| Percentage of prison population | 4.1 |
| UK: Northern Ireland | |
| Number of imprisoned women | 86 |
| Percentage of prison population | 4.6 |
| UK: Scotland | |
| Number of imprisoned women | 328 |
| Percentage of prison population | 4.1 |
Source: Aebi, M. F. & Cocco, E. (2025). SPACE I – 2024 – Council of Europe Annual Penal Statistics: Prison populations. Council of Europe.
Reference date for Czech Republic, Latvia, Lithuania & Portugal: 1st January 2024 (instead of 31st January 2024).
Reference date for Poland and UK (England & Wales): 31st December 2023 (instead of 31st Janaury 2024).
Croatia: Data regarding the female inmate population retrieved from “Women in Prison: Croatia Analysis from the National Preventive Mechanism” of the Republic of Croatia. The reference date is July 2024.
Malta: Data regarding the female inmate population retrieved from the World Prison Brief. The reference date is January 31st, 2024.