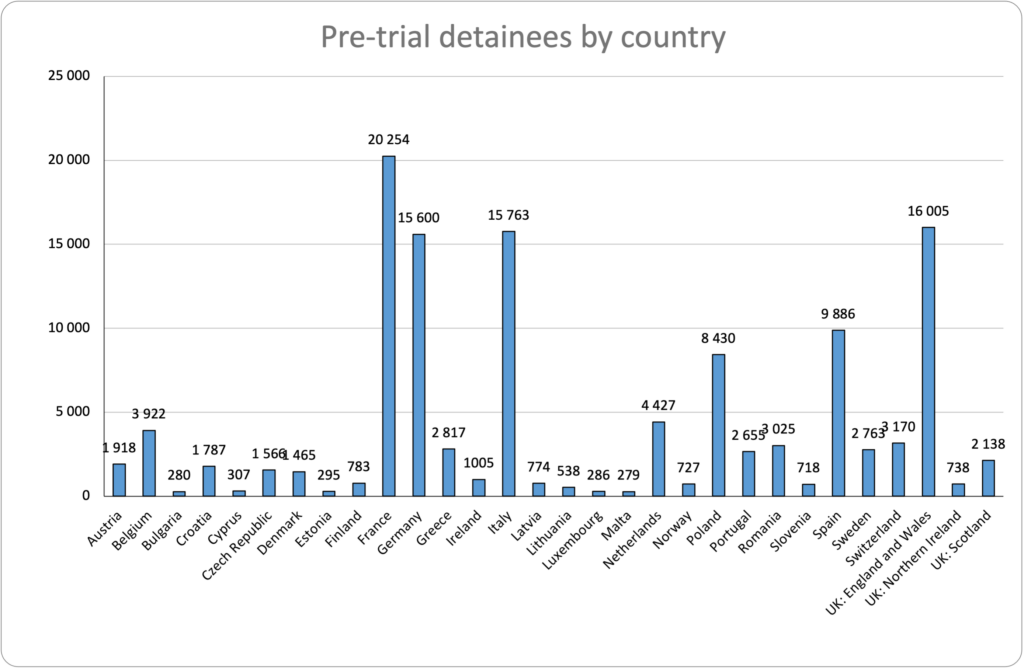
| Albania | |
| Number of people not serving a final sentence | Male: 3,077 Female: 42 Total: 3,119 |
| Percentage of the total prison population | 58.2 |
| Austria | |
| Number of people not serving a final sentence | Male: 1,799 Female: 119 Total: 1,918 |
| Percentage of the total prison population | 20.72 |
| Belgium | |
| Number of people not serving a final sentence | Male: 3,712 Female: 210 Total: 3,922 |
| Percentage of the total prison population | 32.57 |
| Bulgaria | |
| Number of people not serving a final sentence | Male: 265 Female: 15 Total: 280 |
| Percentage of the total prison population | 5.04 |
| Croatia | |
| Number of people not serving a final sentence | Male: 1,697 Female: 90 Total: 1,787 |
| Percentage of the total prison population | 40.2 |
| Cyprus | |
| Number of people not serving a final sentence | Male: 282 Female: 25 Total: 307 |
| Percentage of the total prison population | 30.79 |
| Czech Republic | |
| Number of people not serving a final sentence | Male: 1,440 Female: 126 Total: 1,566 |
| Percentage of the total prison population | 8 |
| Denmark | |
| Number of people not serving a final sentence | Male: 1,371 Female: 94 Total: 1,465 |
| Percentage of the total prison population | 35.48 |
| Estonia | |
| Number of people not serving a final sentence | Male: 275 Female: 20 Total: 295 |
| Percentage of the total prison population | 16.21 |
| Finland | |
| Number of people not serving a final sentence | Male: 712 Female: 71 Total: 783 |
| Percentage of the total prison population | 25.75 |
| France | |
| Number of people not serving a final sentence | Male: 19,306 Female: 948 Total: 20,254 |
| Percentage of the total prison population | 26.55 |
| Germany | |
| Number of people not serving a final sentence | Male: 14,796 Female: 804 Total: 15,600 |
| Percentage of the total prison population | 26.26 |
| Greece | |
| Number of people not serving a final sentence | Male: 2,660 Female: 157 Total: 2,817 |
| Percentage of the total prison population | 27.61 |
| Hungary | |
| Number of people not serving a final sentence | Male: 3,892 Female: 385 Total: 4,277 |
| Percentage of the total prison | 22.8 |
| Ireland | |
| Number of people not serving a final sentence | Male: 936 Female: 69 Total: 1,005 |
| Percentage of the total prison population | 20.9 |
| Italy | |
| Number of people not serving a final sentence | Male: 15,136 Female: 627 Total: 15,763 |
| Percentage of the total prison population | 26 |
| Latvia | |
| Number of people not serving a final sentence | Male: 715 Female: 59 Total: 774 |
| Percentage of the total prison population | 23.66 |
| Lithuania | |
| Number of people not serving a final sentence | Male: 507 Female: 31 Total: 538 |
| Percentage of the total prison population | 11.82 |
| Luxembourg | |
| Number of people not serving a final sentence | Male: 273 Female: 13 Total: 286 |
| Percentage of the total prison population | 46.66 |
| Malta | |
| Number of people not serving a final sentence | Male: 260 Female: 19 Total: 279 |
| Percentage of the total prison population | 41.58 |
| Netherlands | |
| Number of people not serving a final sentence | Male: 4,217 Female: 210 Total: 4,427 |
| Percentage of the total prison population | 45.72 |
| Norway | |
| Number of people not serving a final sentence | Male: 688 Female: 39 Total: 727 |
| Percentage of the total prison population | 24.2 |
| Poland | |
| Number of people not serving a final sentence | Male: 7,906 Female: 524 Total: 8,430 |
| Percentage of the total prison population | 11.42 |
| Portugal | |
| Number of people not serving a final sentence | Male: 2,422 Female: 233 Total: 2,655 |
| Percentage of the total prison population | 21.77 |
| Romania | |
| Number of people not serving a final sentence | Male: 2,879 Female: 146 Total: 3,025 |
| Percentage of the total prison population | 12.67 |
| Slovakia | |
| Number of people not serving a final sentence | Male: 1,320 Female: 99 Total: 1,419 |
| Percentage of the total prison population | 14.59 |
| Slovenia | |
| Number of people not serving a final sentence | Male: 687 Female: 31 Total: 718 |
| Percentage of the total prison population | 39.76 |
| Spain | |
| Number of people not serving a final sentence | Male: 9,272 Female: 614 Total: 9,886 |
| Percentage of the total prison population | 17.35 |
| Sweden | |
| Number of people not serving a final sentence | Male: 2,533 Female: 230 Total: 2,763 |
| Percentage of the total prison population | 28.34 |
| Switzerland | |
| Number of people not serving a final sentence | Male: 2,977 Female: 193 Total: 3,170 |
| Percentage of the total prison population | 46.07 |
| Turkey | |
| Number of people not serving a final sentence | Male: 43,051 Female: 2,565 Total: 45,616 |
| Percentage of the total prison population | 15.02 |
| UK: England and Wales | |
| Number of people not serving a final sentence | Male: 15,215 Female: 790 Total: 16,005 |
| Percentage of the total prison population | 18.29 |
| UK: Northern Ireland | |
| Number of people not serving a final sentence | Male: 700 Female: 38 Total: 738 |
| Percentage of the total prison population | 39.3 |
| UK: Scotland | |
| Number of people not serving a final sentence | Male: 2,016 Female: 122 Total: 2,138 |
| Percentage of the total prison population | 26.95 |
| Total Number of people not serving a final sentence | 124,321 |
Source: Aebi, M. F. & Cocco, E. (2025). SPACE I – 2024 – Council of Europe Annual Penal Statistics: Prison populations. Council of Europe.
Reference date for Czech Republic, Latvia, Lithuania & Portugal is 1st January 2024 (instead of 31st January 2024) Reference date for Poland & UK (England and Wales) is 31st December 2023 (instead of 31st January 2024)