| Austria | |
| Number of foreigners detained | Male: 4,648 Female: 243 Total: 4,891 |
| Percentage of the total prison population | 52.83 |
| Belgium | |
| Number of foreigners detained | Male: 4,819 Female: 164 Total: 4,983 |
| Percentage of the total prison population | 41.38 |
| Bulgaria | |
| Number of foreigners detained | Male: 158 Female: 3 Total: 161 |
| Percentage of the total prison population | 2.9 |
| Croatia | |
| Number of foreigners detained | Male: 36 Female: 1 Total: 37 |
| Percentage of the total prison population | 0.83 |
| Cyprus | |
| Number of foreigners detained | Male: 525 Female: 49 Total: 574 |
| Percentage of the total prison population | 57.57 |
| Czech Republic | |
| Number of foreigners detained | Male: 1,554 Female: 97 Total: 1,651 |
| Percentage of the total prison population | 8.44 |
| Denmark | |
| Number of foreigners detained | Male: 1,055 Female: 58 Total: 1,113 |
| Percentage of the total prison population | 26.96 |
| Estonia | |
| Number of foreigners detained | Male: 176 Female: 16 Total: 192 |
| Percentage of the total prison population | 10.55 |
| Finland | |
| Number of foreigners detained | Male: 582 Female: 33 Total: 615 |
| Percentage of the total prison population | 20.22 |
| France | |
| Number of foreigners detained | Male: 18,173 Female: 579 Total: 18,752 |
| Percentage of the total prison population | 24.58 |
| Germany | |
| Number of foreigners detained | Male: NA Female: NA Total: 15,210* |
| Percentage of the total prison population | 25.6* |
| Greece | |
| Number of foreigners detained | Male: 5,365 Female: 153 Total: 5,518 |
| Percentage of the total prison population | 54.08 |
| Ireland | |
| Number of foreigners detained | Male: 724 Female: 36 Total: 760 |
| Percentage of the total prison population | 15.81 |
| Italy | |
| Number of foreigners detained | Male: 18,248 Female: 737 Total: 18,985 |
| Percentage of the total prison population | 31.31 |
| Latvia | |
| Number of foreigners detained | Male: 103 Female: 12 Total: 115 |
| Percentage of the total prison population | 3.52 |
| Lithuania | |
| Number of foreigners detained | Male: 152 Female: 1 Total: 153 |
| Percentage of the total prison population | 3.36 |
| Luxembourg | |
| Number of foreigners detained | Male: 446 Female: 16 Total: 462 |
| Percentage of the total prison population | 75.37 |
| Malta | |
| Number of foreigners detained | Male: 325 Female: 23 Total: 348 |
| Percentage of the total prison population | 51.86 |
| Netherlands | |
| Number of foreigners detained | Male: 2,242 Female: 112 Total: 2,354 |
| Percentage of the total prison population | 24.31 |
| Norway | |
| Number of foreigners detained | Male: 757 Female: 40 Total: 797 |
| Percentage of the total prison population | 26.53 |
| Poland | |
| Number of foreigners detained | Male: 1,202 Female: 65 Total: 1,267 |
| Percentage of the total prison population | 1.9 |
| Portugal | |
| Number of foreigners detained | Male: 2,246 Female: 94 Total: 2,340 |
| Percentage of the total prison population | 3.17 |
| Romania | |
| Number of foreigners detained | Male: 255 Female: 8 Total: 263 |
| Percentage of the total prison population | 1.1 |
| Slovenia | |
| Number of foreigners detained | Male: 836 Female: 32 Total: 868 |
| Percentage of the total prison population | 48.06 |
| Spain | |
| Number of foreigners detained | Male: 16,791 Female: 1,000 Total: 17,791 |
| Percentage of the total prison population | 31.22 |
| Sweden | |
| Number of foreigners detained | Male: NA Female: NA Total: 1,628* |
| Percentage of the total prison population | 16.7* |
| Switzerland | |
| Number of foreigners detained | Male: NA Female: NA Total: 5,071* |
| Percentage of the total prison population | 72.5* |
| UK: England and Wales | |
| Number of foreigners detained | Male: 10,047 Female: 376 Total: 10,426 |
| Percentage of the total prison population | 11.91 |
| UK: Northern Ireland | |
| Number of foreigners detained | Male: 184 Female: 10 Total: 194 |
| Percentage of the total prison population | 10.33 |
| UK: Scotland | |
| Number of foreigners detained | Male: 501 Female: 18 Total: 519 |
| Percentage of the total prison population | 6.54 |
| Total Number of foreigners detained | 118,804 |
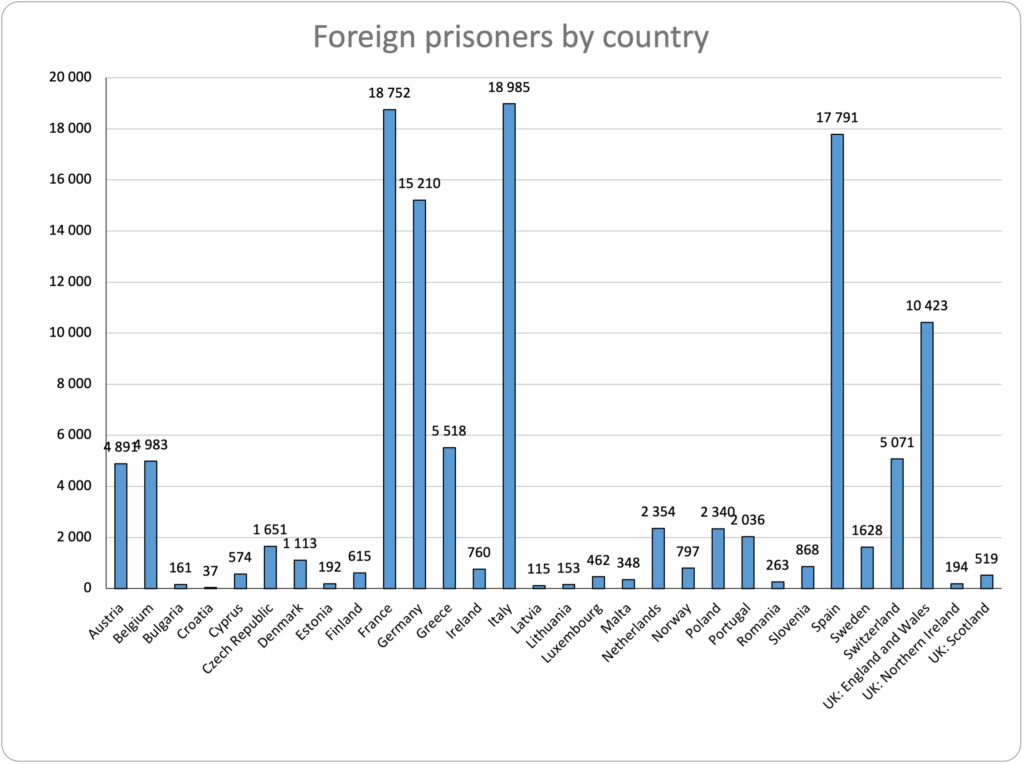
Source: Aebi, M. F. & Cocco, E. (2025). SPACE I – 2024 – Council of Europe Annual Penal Statistics: Prison populations. Council of Europe.
Reference date for Czech Republic, Latvia, Lithuania & Portugal is 1st January 2024 (instead of 31st January 2024)
Reference date for Poland & UK (England and Wales) is 31st December 2023 (instead of 31st January 2024)
*Germany, percentage of imprisoned foreigners was retrieved from Prison Insider (reference date: 2023). The number of imprisoned foreigners was calculated based on the foreign percentage from Prison Insider and the total data from the COE SPACE I 2024.
*Sweden, percentage of imprisoned foreigners was retrieved from Prison Insider (reference date: 1st October 2022). The number of imprisoned foreigners was calculated based on the foreign percentage from Prison Insider and the total data from the COE SPACE I 2024.
*Switzerland, percentage of imprisoned foreigners was retrieved from Prison Insider (reference date: 31st January 2025). The number of imprisoned foreigners was calculated based on the foreign percentage from Prison Insider and the total data from the COE SPACE I 2024.