| Austria | |
| Number of inmates not serving a final sentence | Male: 1,567 Female: 126 Total: 1,693 |
| Percentage of the total prison population | 20 |
| Belgium | |
| Number of inmates not serving a final sentence | Male: 3,745 Female: 238 Total: 3,983 |
| Percentage of the total prison population | 38.3 |
| Bulgaria | |
| Number of inmates not serving a final sentence | Male: 1,424 Female: 51 Total: 1,475 |
| Percentage of the total prison population | 20.9 |
| Croatia | |
| Number of inmates not serving a final sentence | Male: 1,208 Female: 73 Total: 1,281 |
| Percentage of the total prison population | 36.3 |
| Cyprus | |
| Number of inmates not serving a final sentence | Male: 151 Female: 8 Total: 159 |
| Percentage of the total prison population | 26.5 |
| Czech Republic | |
| Number of inmates not serving a final sentence | Male: 1,467 Female: 103 Total: 1,507 |
| Percentage of the total prison population | 8.1 |
| Denmark | |
| Number of inmates not serving a final sentence | Male: 1,224 Female: 88 Total: 1,312 |
| Percentage of the total prison population | 33.6 |
| Estonia | |
| Number of inmates not serving a final sentence | Male: 439 Female: 20 Total: 459 |
| Percentage of the total prison population | 19.6 |
| Finland | |
| Number of inmates not serving a final sentence | Male: 470 Female: 48 Total: 518 |
| Percentage of the total prison population | 21.6 |
| France | |
| Number of inmates not serving a final sentence | Male: 17,065 Female: 791 Total: 17,856 |
| Percentage of the total prison population | 28.5 |
| Germany | |
| Number of inmates not serving a final sentence | Male: 11,529 Female: 665 Total: 12,194 |
| Percentage of the total prison population | 20.6 |
| Greece | |
| Number of inmates not serving a final sentence | Male: 2,518 Female: 144 Total: 2,662 |
| Percentage of the total prison population | 23.5 |
| Hungary | |
| Number of inmates not serving a final sentence | Male: 3,229 Female: 340 Total: 3,569 |
| Percentage of the total prison population | 20.4 |
| Ireland | |
| Number of inmates not serving a final sentence | Male: 722 Female: 42 Total: 764 |
| Percentage of the total prison population | 20.5 |
| Italy | |
| Number of inmates not serving a final sentence | Male: 16,118 Female: 673 Total: 16,791 |
| Percentage of the total prison population | 31.5 |
| Latvia | |
| Number of inmates not serving a final sentence | Male: 734 Female: 61 Total: 795 |
| Percentage of the total prison population | 26.1 |
| Lithuania | |
| Number of inmates not serving a final sentence | Male: 581 Female: 45 Total: 626 |
| Percentage of the total prison population | 11.8 |
| Luxembourg | |
| Number of inmates not serving a final sentence | Male: 228 Female: 13 Total: 241 |
| Percentage of the total prison population | 43.3 |
| Malta | |
| Number of inmates not serving a final sentence | Male: Female: Total: 229 (2020)* |
| Percentage of the total prison population | 28.9 (2020)* |
| Netherlands | |
| Number of inmates not serving a final sentence | Male: 4,072 Female: 181 Total: 4,253 |
| Percentage of the total prison population | 45.2 |
| Norway | |
| Number of inmates not serving a final sentence | Male: 666 Female: 46 Total: 712 |
| Percentage of the total prison population | 23.3 |
| Poland | |
| Number of inmates not serving a final sentence | Male: 8,239 Female: 453 Total: 8,692 |
| Percentage of the total prison population | 12.8 |
| Portugal | |
| Number of inmates not serving a final sentence | Male: 2,064 Female: 209 Total: 2,273 |
| Percentage of the total prison population | 19.9 |
| Romania | |
| Number of inmates not serving a final sentence | Male: 2,180 Female: 83 Total: 2,263 |
| Percentage of the total prison population | 10.4 |
| Slovakia | |
| Number of inmates not serving a final sentence | Male: 1,485 Female: 133 Total: 1,618 |
| Percentage of the total prison population | 15.4 |
| Slovenia | |
| Number of inmates not serving a final sentence | Male: 359 Female: 17 Total: 376 |
| Percentage of the total prison population | 33.1 |
| Spain | |
| Number of inmates not serving a final sentence | Male: 8,067 Female: 547 Total: 8,614 |
| Percentage of the total prison population | 15.6 |
| Sweden | |
| Number of inmates not serving a final sentence | Male: 1,894 Female: 127 Total: 2,021 |
| Percentage of the total prison population | 27.7 |
| Switzerland | |
| Number of inmates not serving a final sentence | Male: 2,697 Female: 187 Total: 2,884 |
| Percentage of the total prison population | 45.7 |
| UK: England and Wales | |
| Number of inmates not serving a final sentence | Male: 11,502 Female: 564 Total: 12,066 |
| Percentage of the total prison population | 15.4 |
| UK: Northern Ireland | |
| Number of inmates not serving a final sentence | Male: 526 Female: 36 Total: 562 |
| Percentage of the total prison population | 39.7 |
| UK: Scotland | |
| Number of inmates not serving a final sentence | Male: 1,850 Female: 98 Total: 1,948 |
| Percentage of the total prison population | 26.2 |
| Total Number of inmates not serving a final sentence | 116,459 |
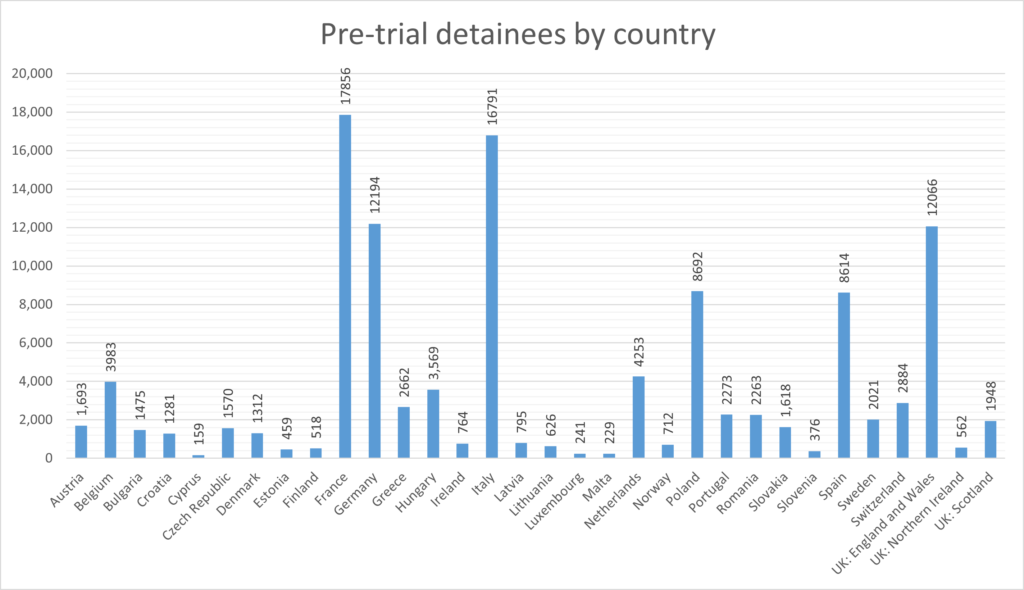
Source: Aebi, M. F., & Tiago, M. M. (2021). SPACE I – 2020 – Council of Europe Annual Penal Statistics: Prison populations. Strasbourg: Council of Europe, Table 7.
Reference date for Croatia, Poland, and UK (England and Wales): 31st December 2020 (instead of 31st January 2021).
Reference date for Estonia and Latvia: 1st January 2020 (instead of 31st January 2021).
Reference date for Lithuania and Portugal: 1st January 2021 (instead of 31st Januay 2021).
Reference date for Sweden: 1st October 2020 (instead of 31st January 2021).
*Malta, People not serving a final servence: retrieved from COE SPACE I REPORT 2020.